I got an opportunity to work extensively with redshift as part of the BI team in Myntra. Redshift powered the core data warehousing logic and enabled business users to query on the data through applications built on top of it. While there were multiple benefits of using Redshift (‘out-of-box’ solution, minimal maintenance of cluster, ability to focus on business logic), there was a downside - it was difficult to debug performance issues.
A bit of background
Key reporting requirements are serviced from ETL refreshes of the data warehouse. Delays in this processing results in delayed/incorrect reports on key metrics. Slow execution of user queries hamper the ability to take swift business decisions. The root cause of the poor performance is quite often a combination of multiple factors - poorly written queries, a spike in queries from specific users, concurrent execution of resource intensive ETL’s etc.
Motivation
In order to identify the bottleneck(s) we needed to be able to quantify each metric that impacts system performance. The AWS cloudwatch service displays hardware metrics like CPU, disk space, read/write IOPS/latency and throughput along with a query dashboard and serves as a great starting point. However, (after you convince your tech lead to share the company's AWS credentials with you and then wait for a few minutes for the graph to load) it fails to capture aggregate trends in query patterns that become critical in detecting anomalies in the redshift cluster.
RedEye is a tool that presents this and a variety of other data points to help debug performance issues with ease. It relies on Statsd for storing time series data and MySQL for query/table level data. Hardware metrics are gathered from the AWS Cloudwatch service and individual/aggregate query metrics are obtained by querying system tables in redshift. A working instance of Statsd and MySQL are necessary for this tool to operate.
Sample Dashboard
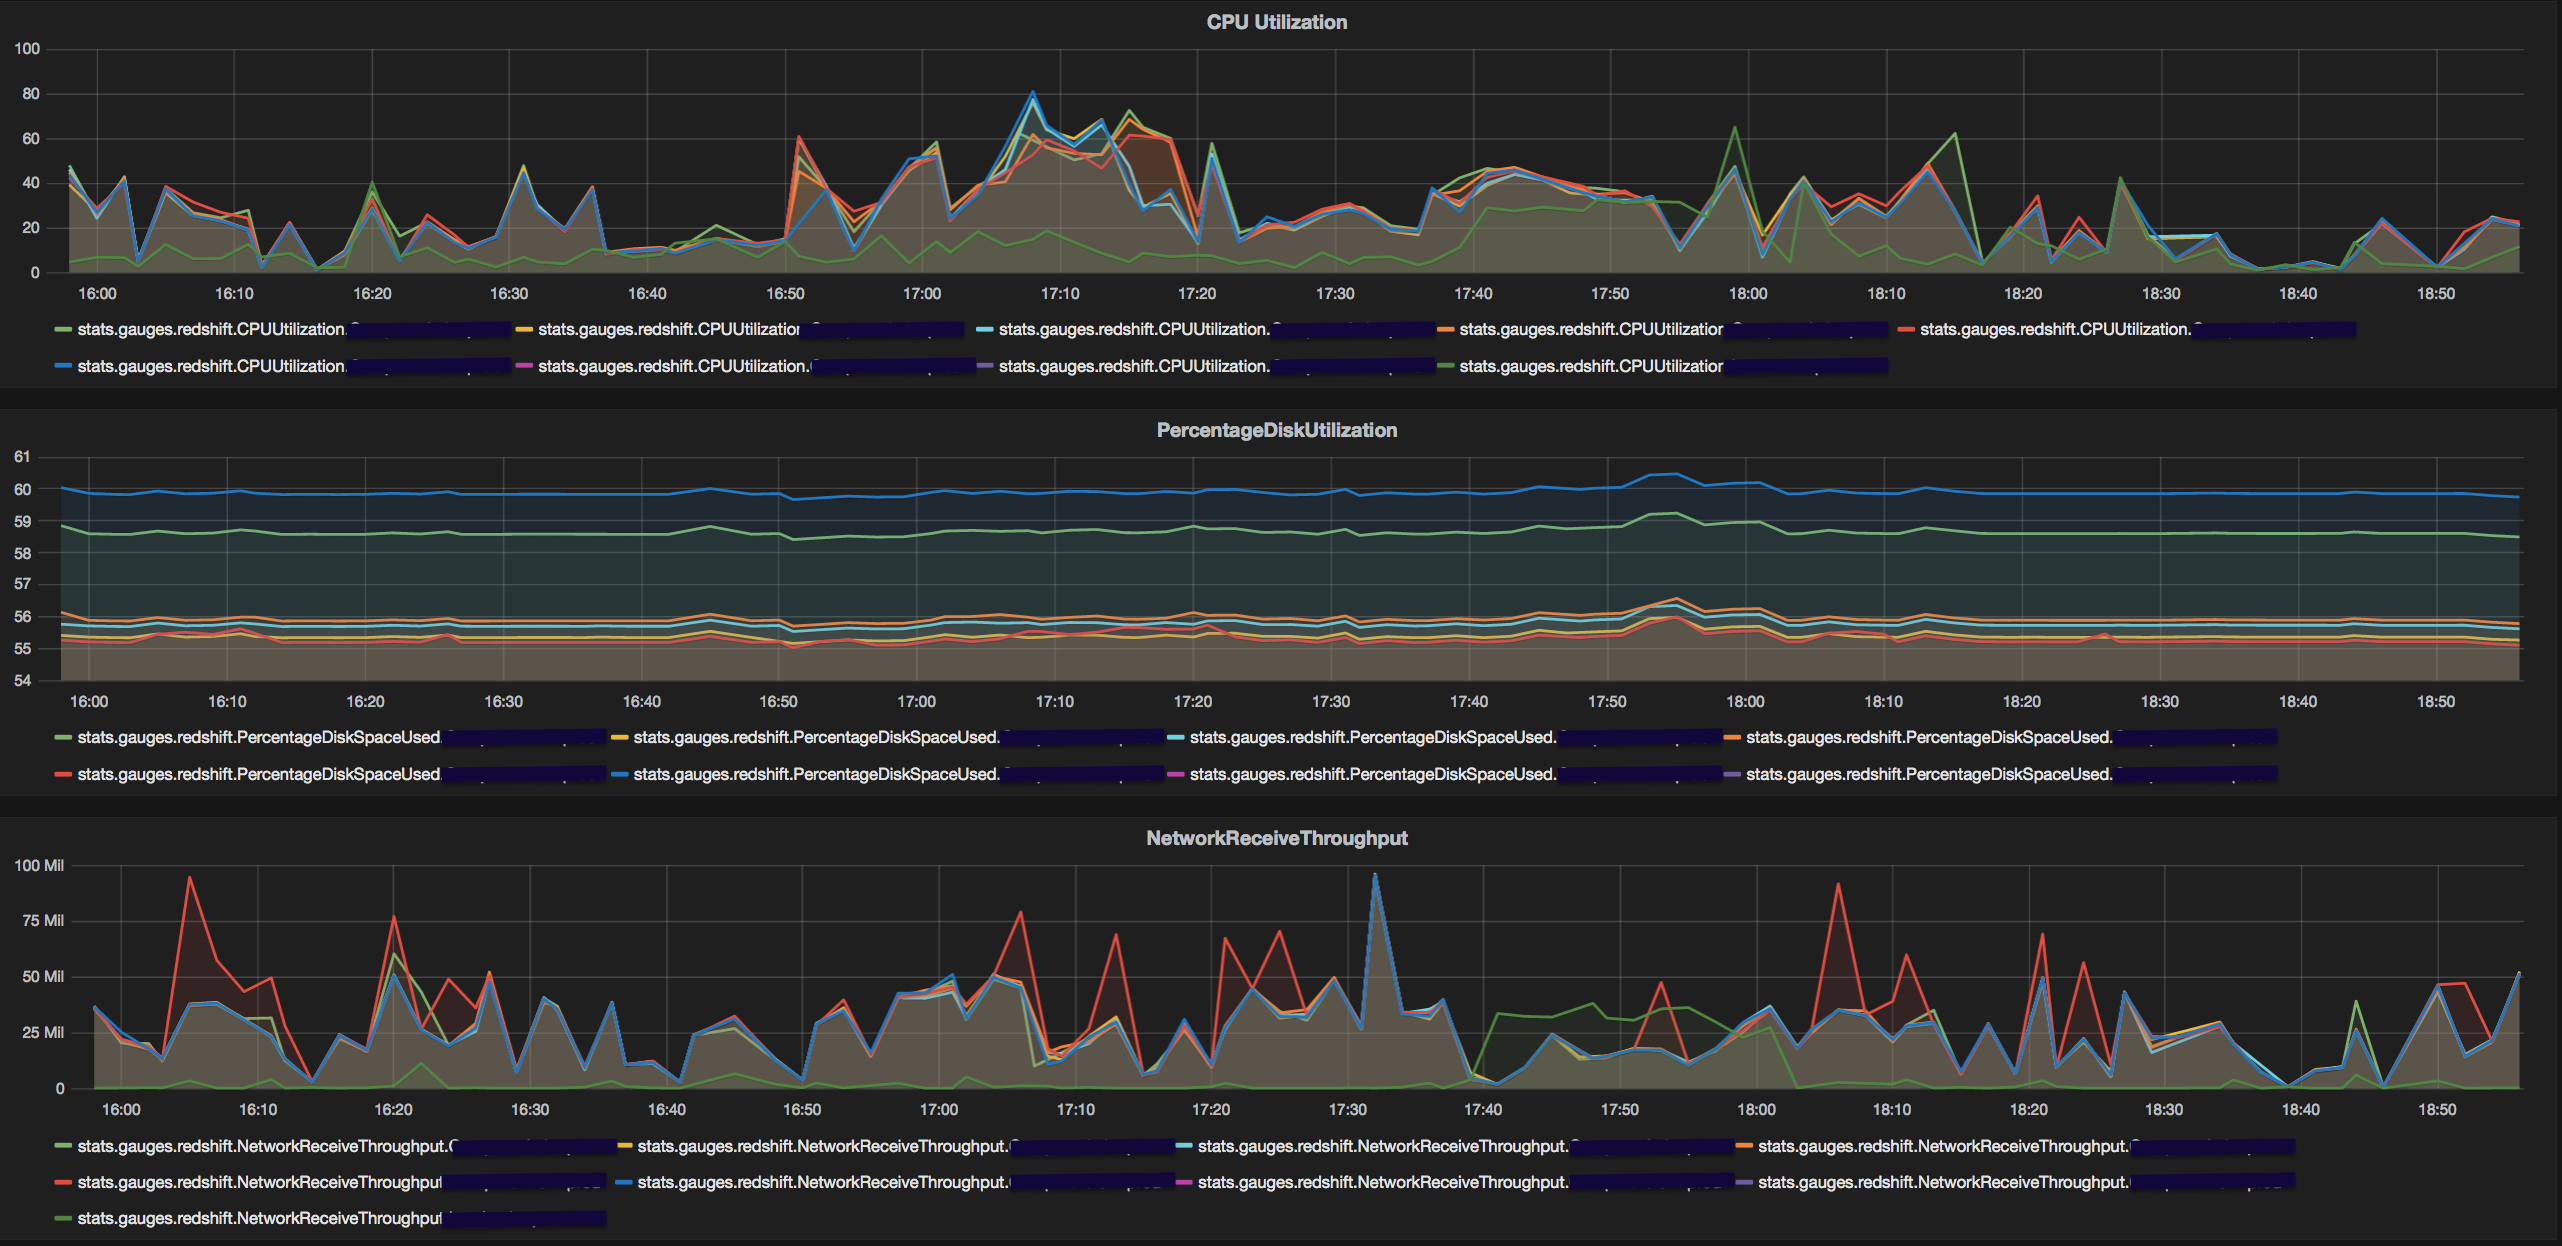
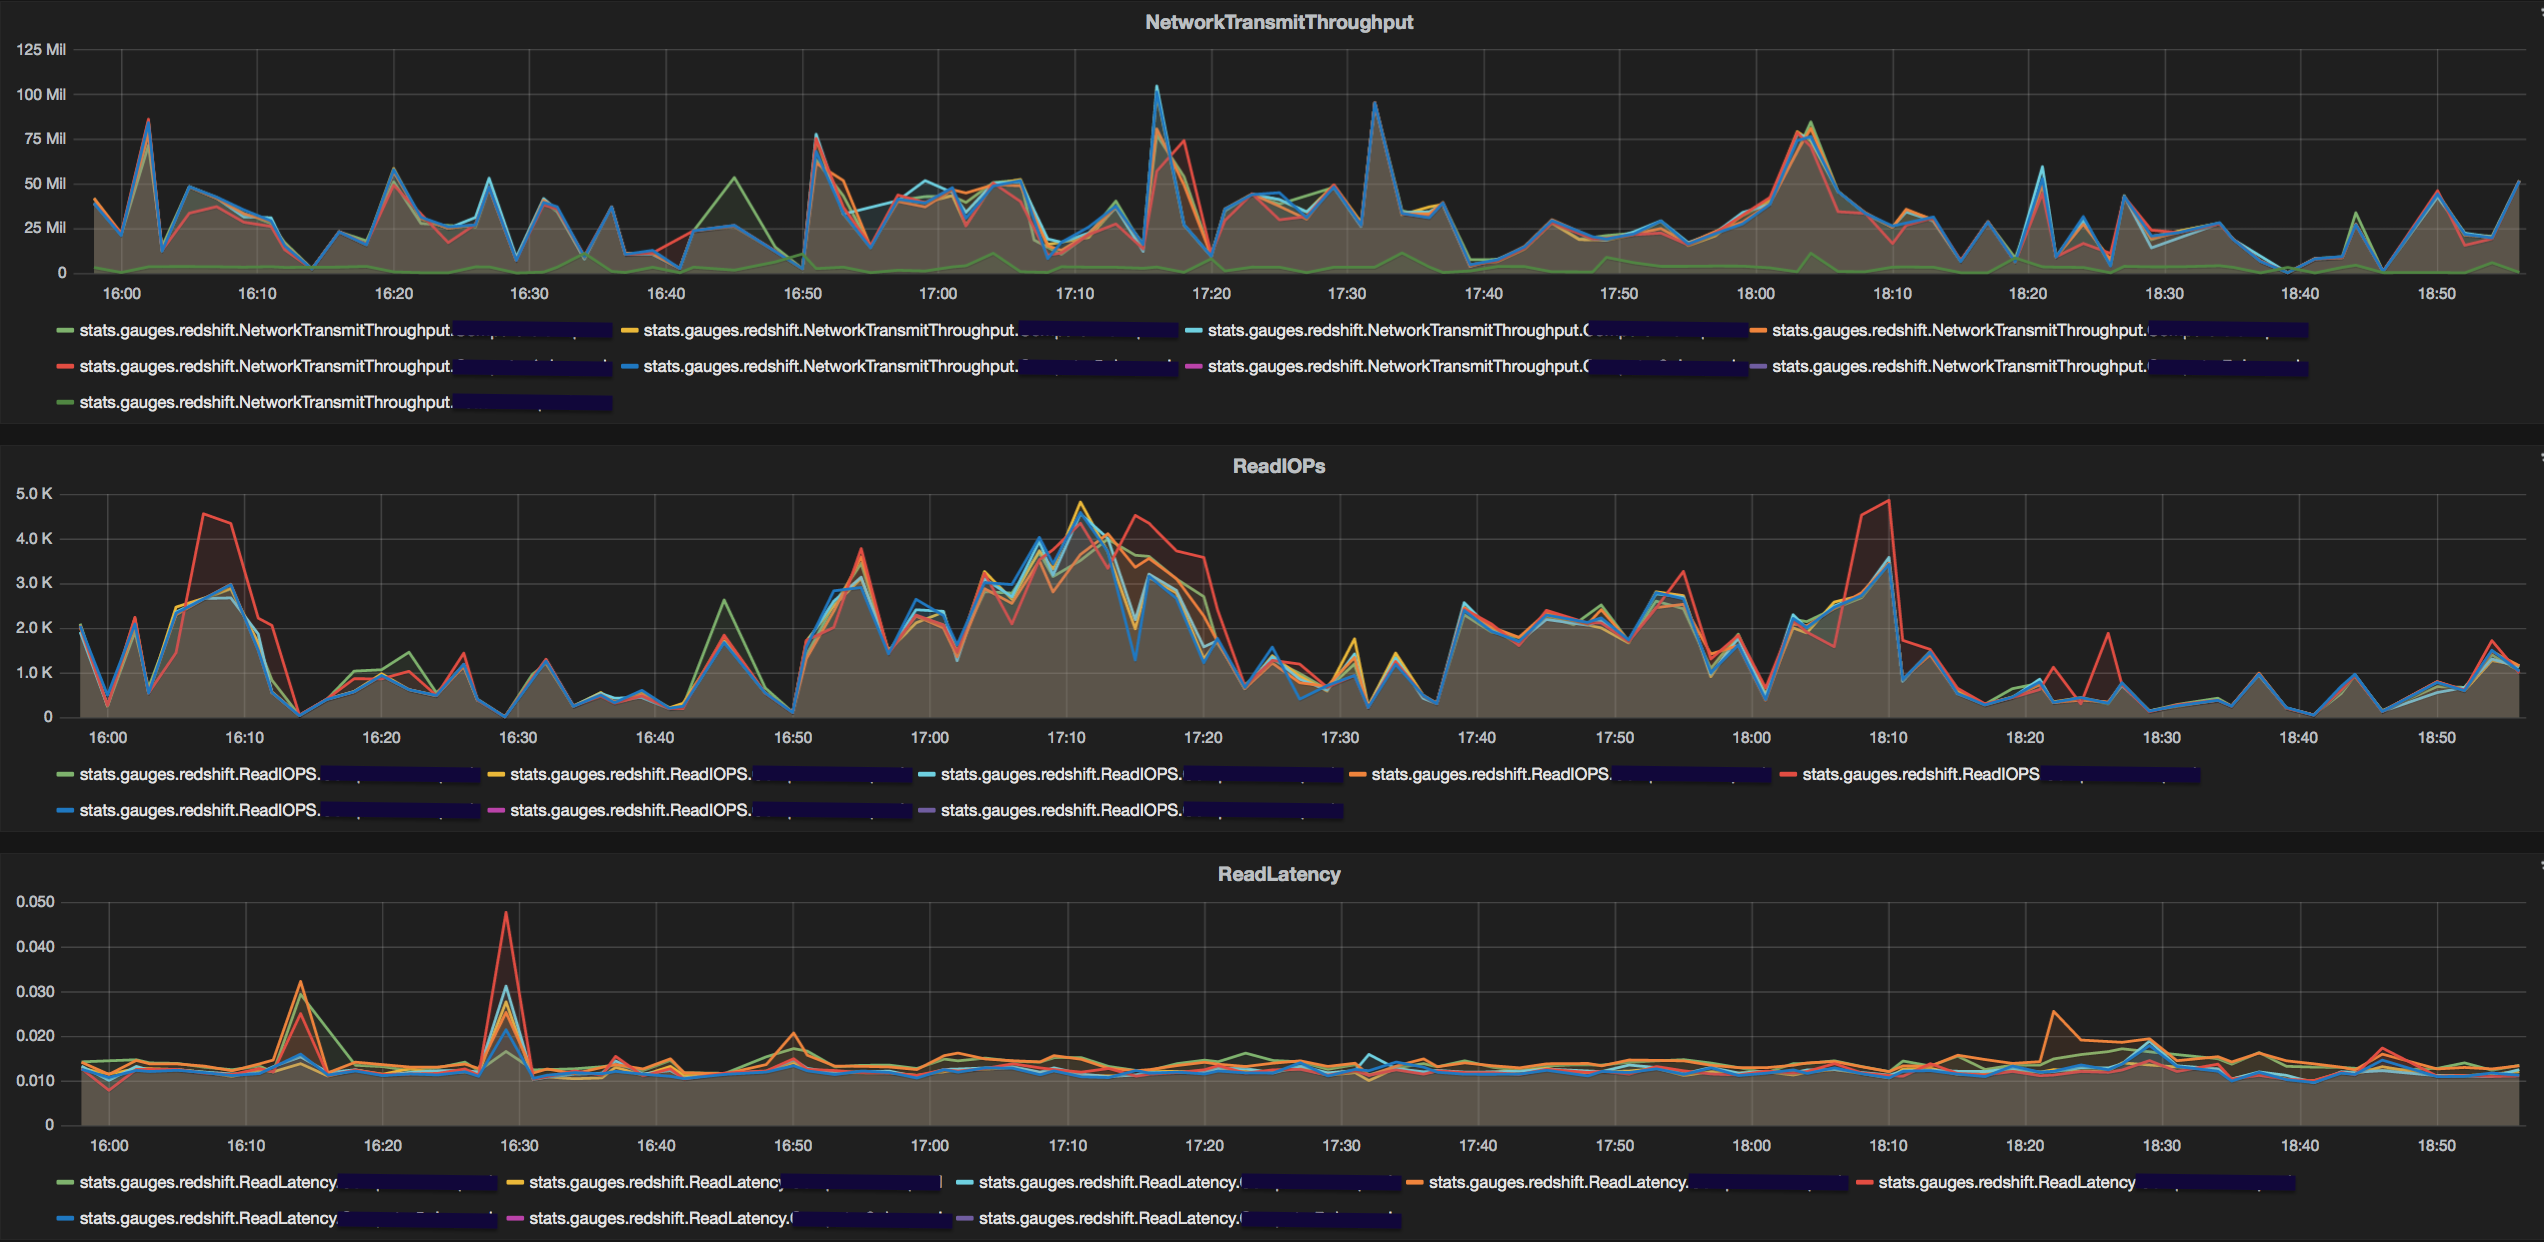
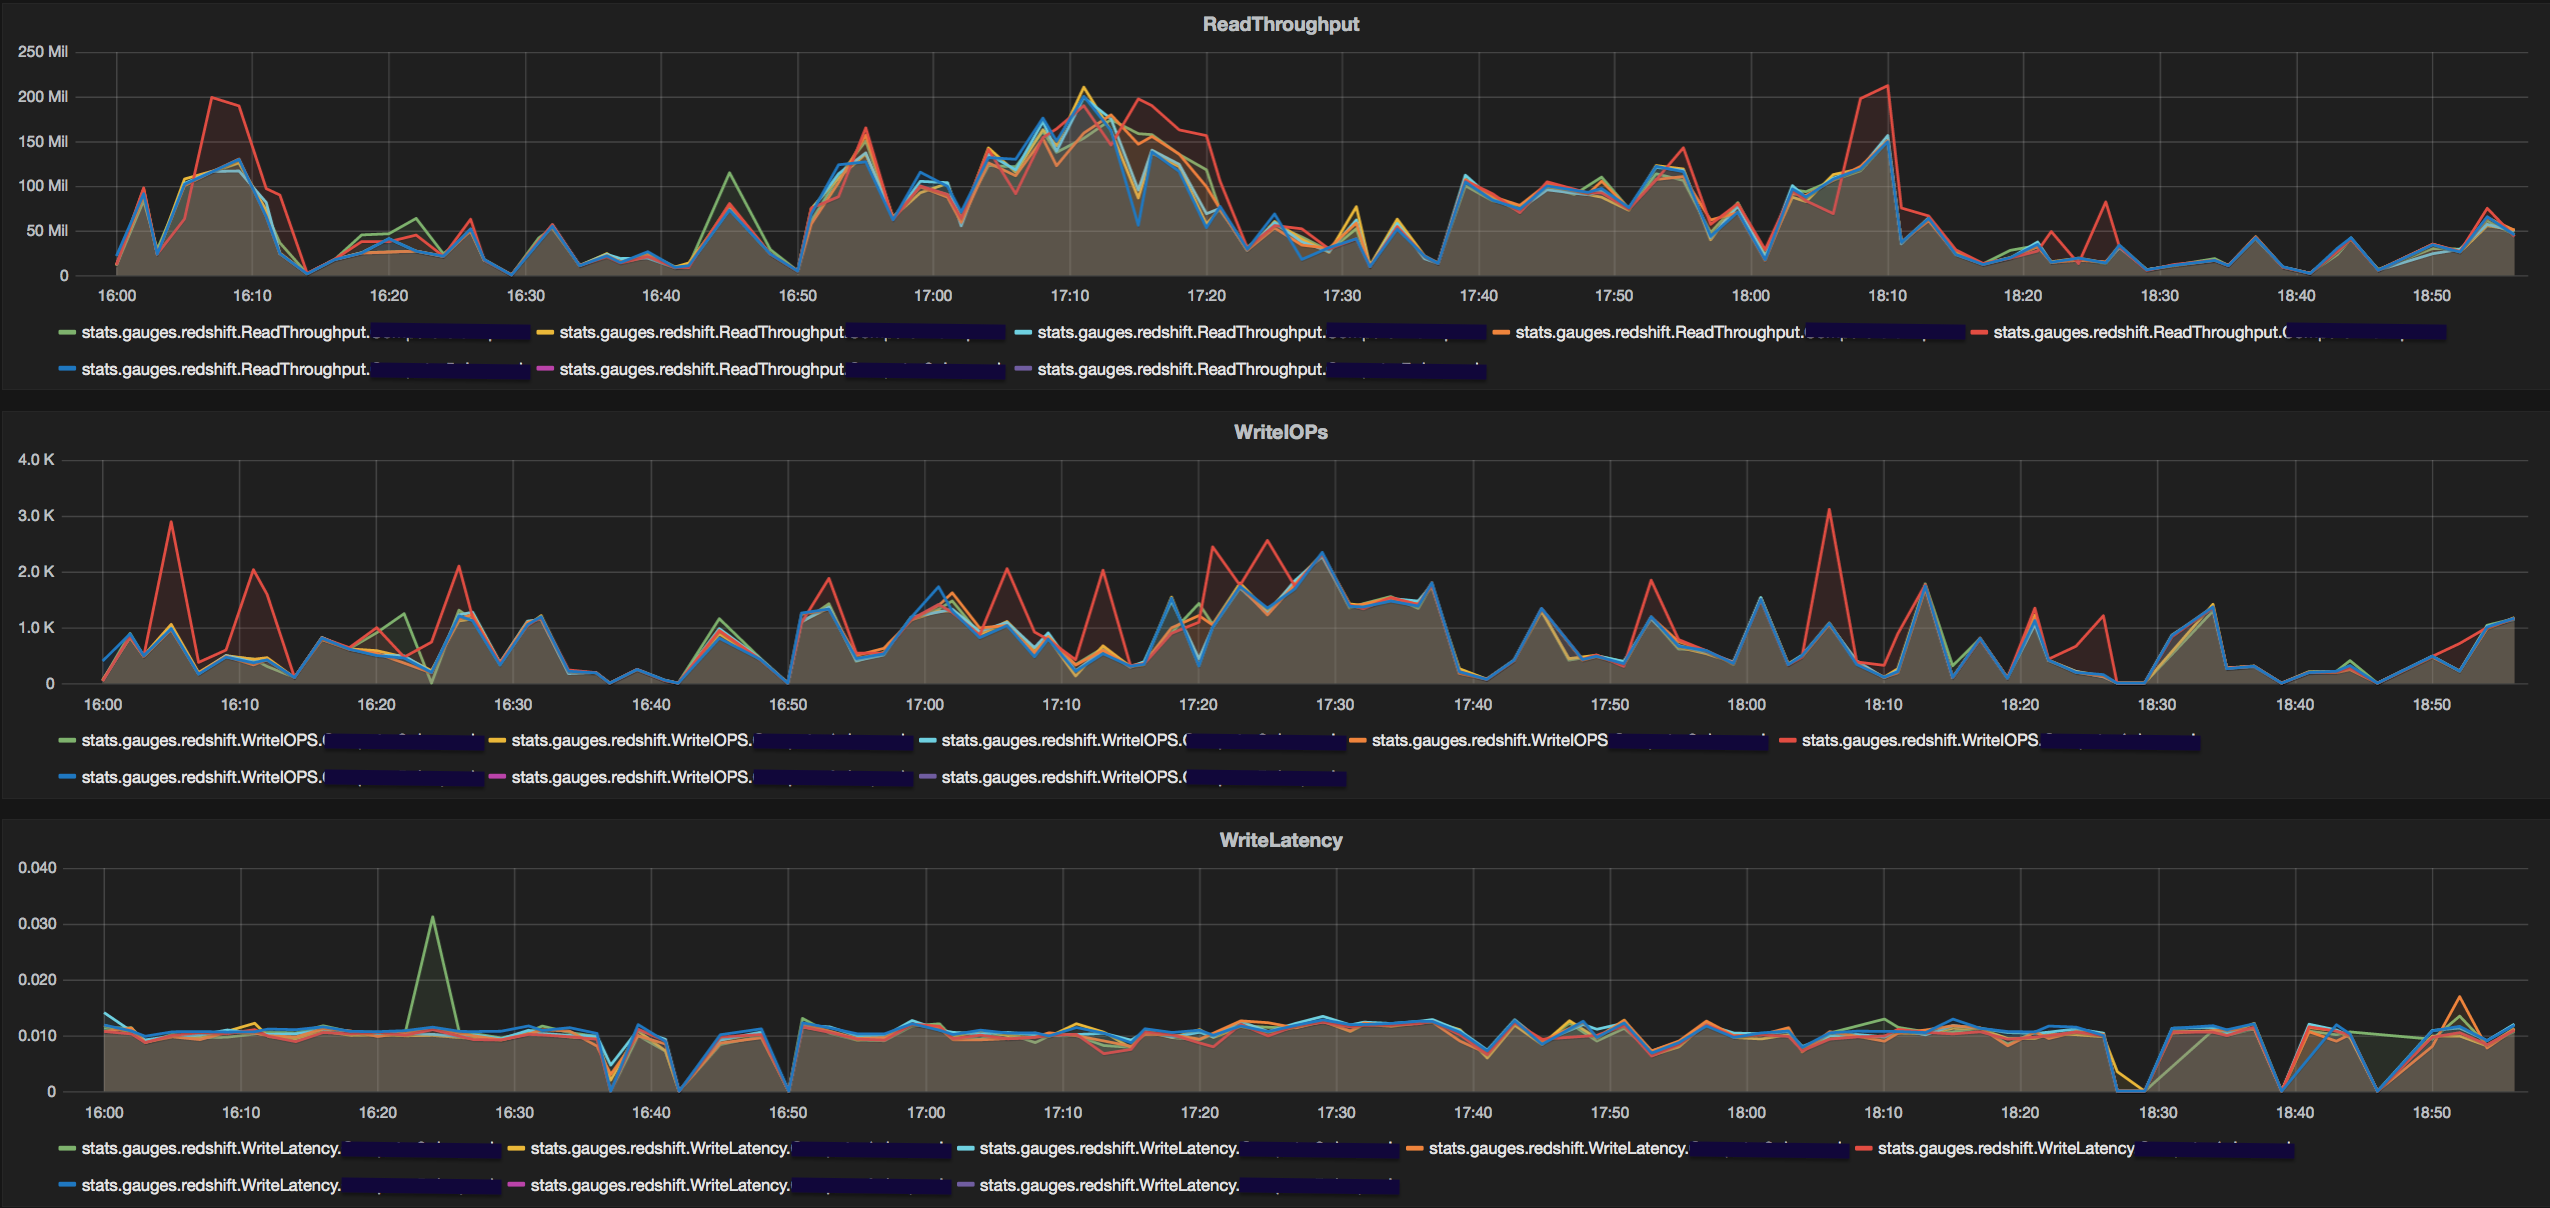
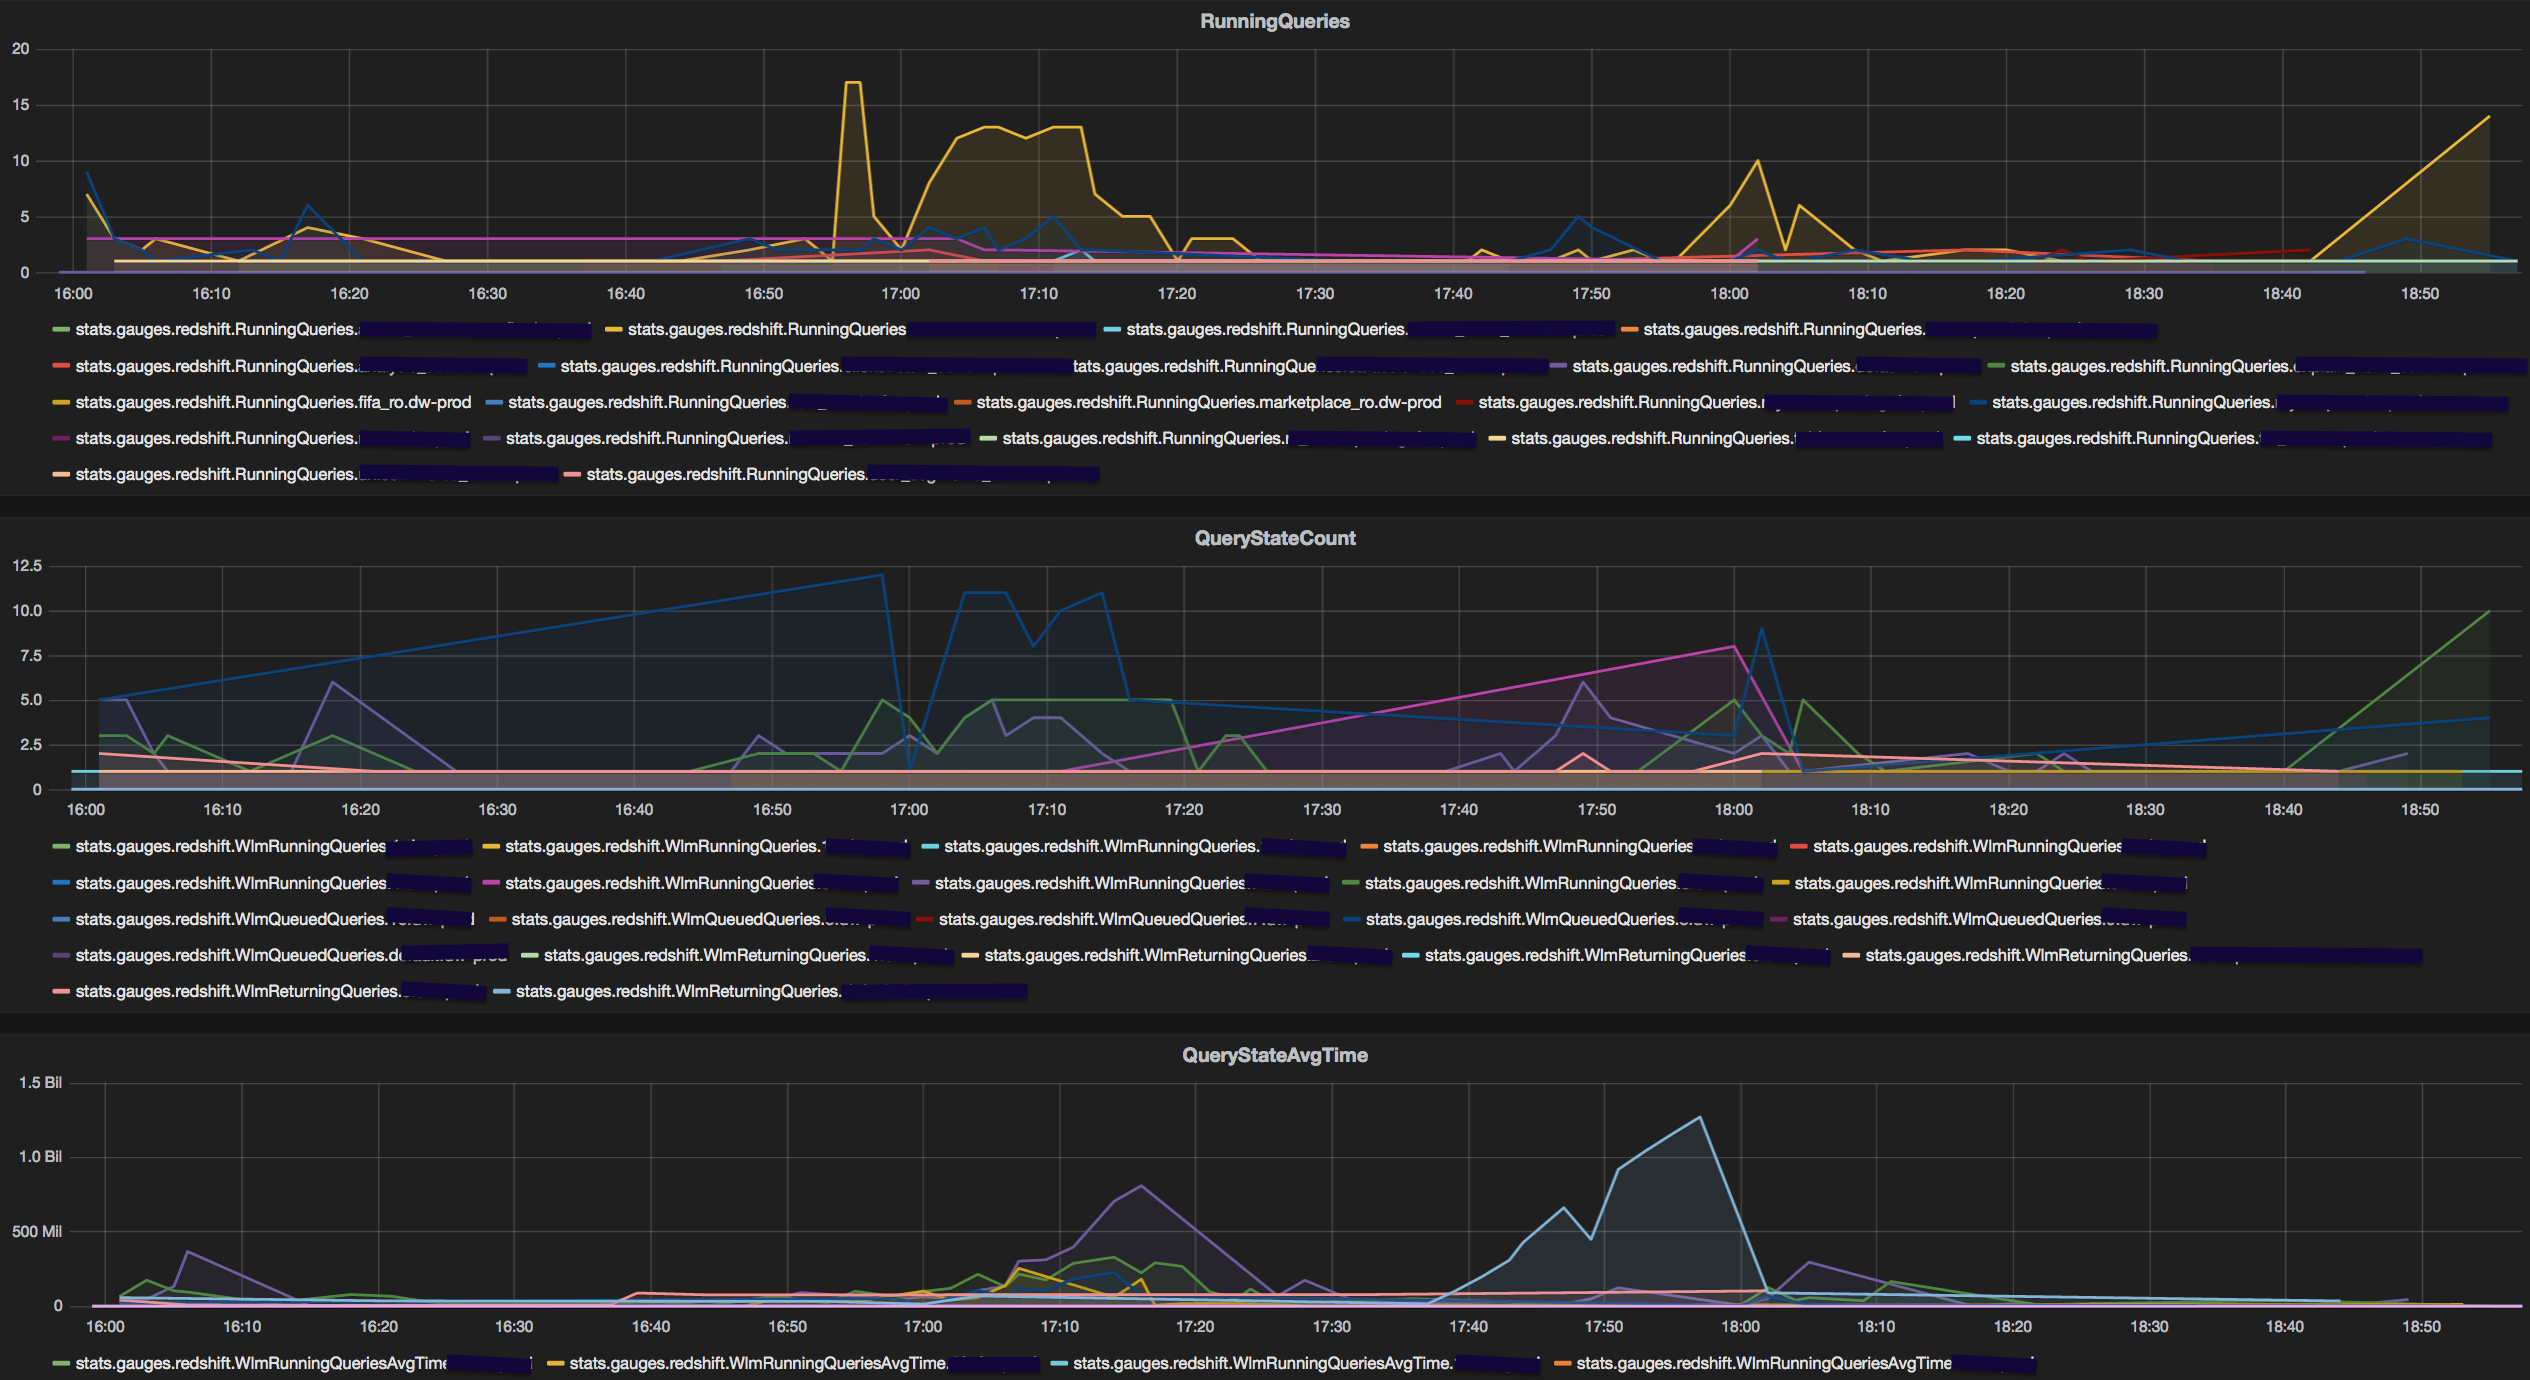

Let's infer
The code can be found here.
I will attempt to illustrate some of the insights that we were able to derive from this unified dashboard . Given that the cluster is experiencing poor performance, the following are the combination of observations that could help identify the root cause of specific performance issues.
Too many of them
The most common cause could be an unusually high number of queries from a single user. Our in house querying application allows users to schedule queries on redshift. Hence it is usual to see peaks from specific users on the database in certain time windows. RedEye displays a count of queries by user and makes it easy to spot an unusually high number of queries from a specific user. This information is obtained from stv_recents. There's a lot more queries fired by the user in yellow on 27th of that month.

Waiting...
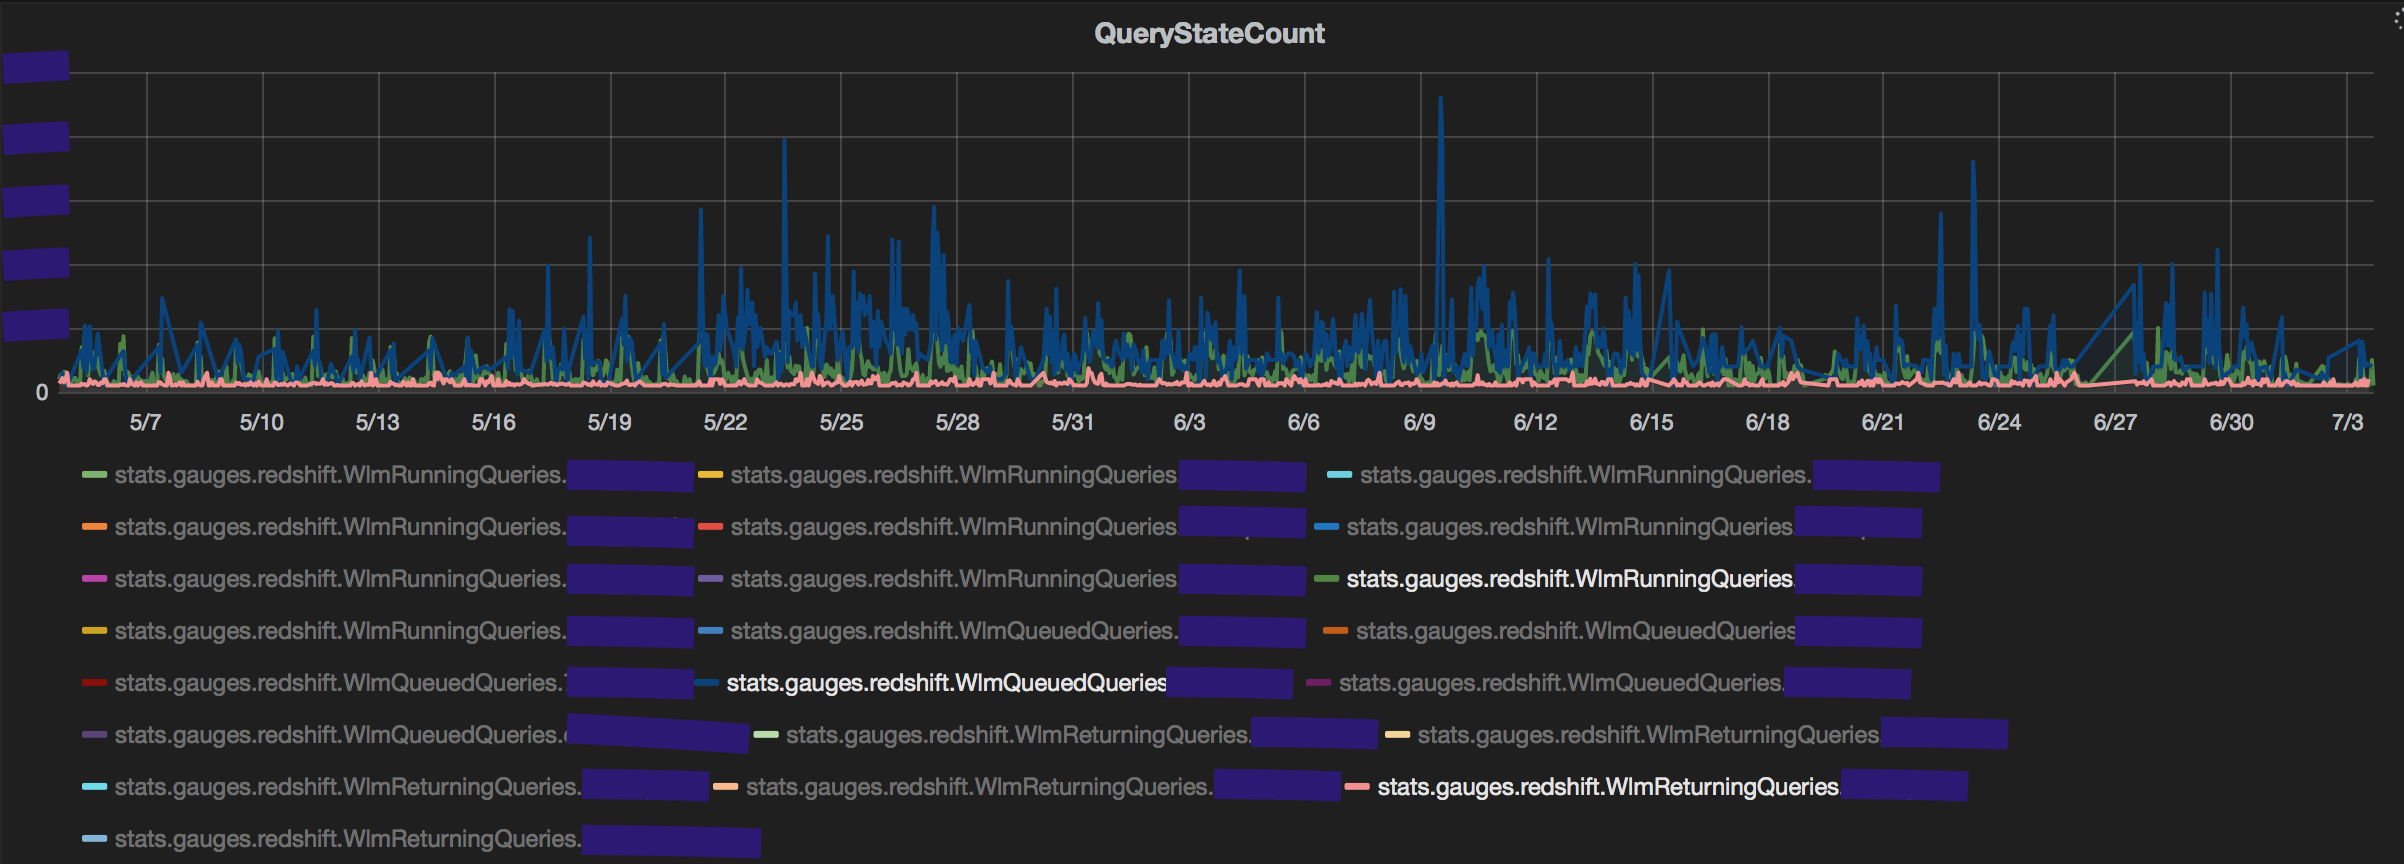
A consequence of having too many queries from a single user is high number of queued queries. To evaluate if that indeed is the reason for query 'slowness', the dashboard displays the count of queries by in each state (Queued/Running/Returning) for every service class (queue) in Redshift. The graph makes it easy to judge if service class is being under utilised or over burdened. The stv_wlm_query_state table is used to gather all service class metrics. The number of queries queued in blue are significantly higher than the same in red.
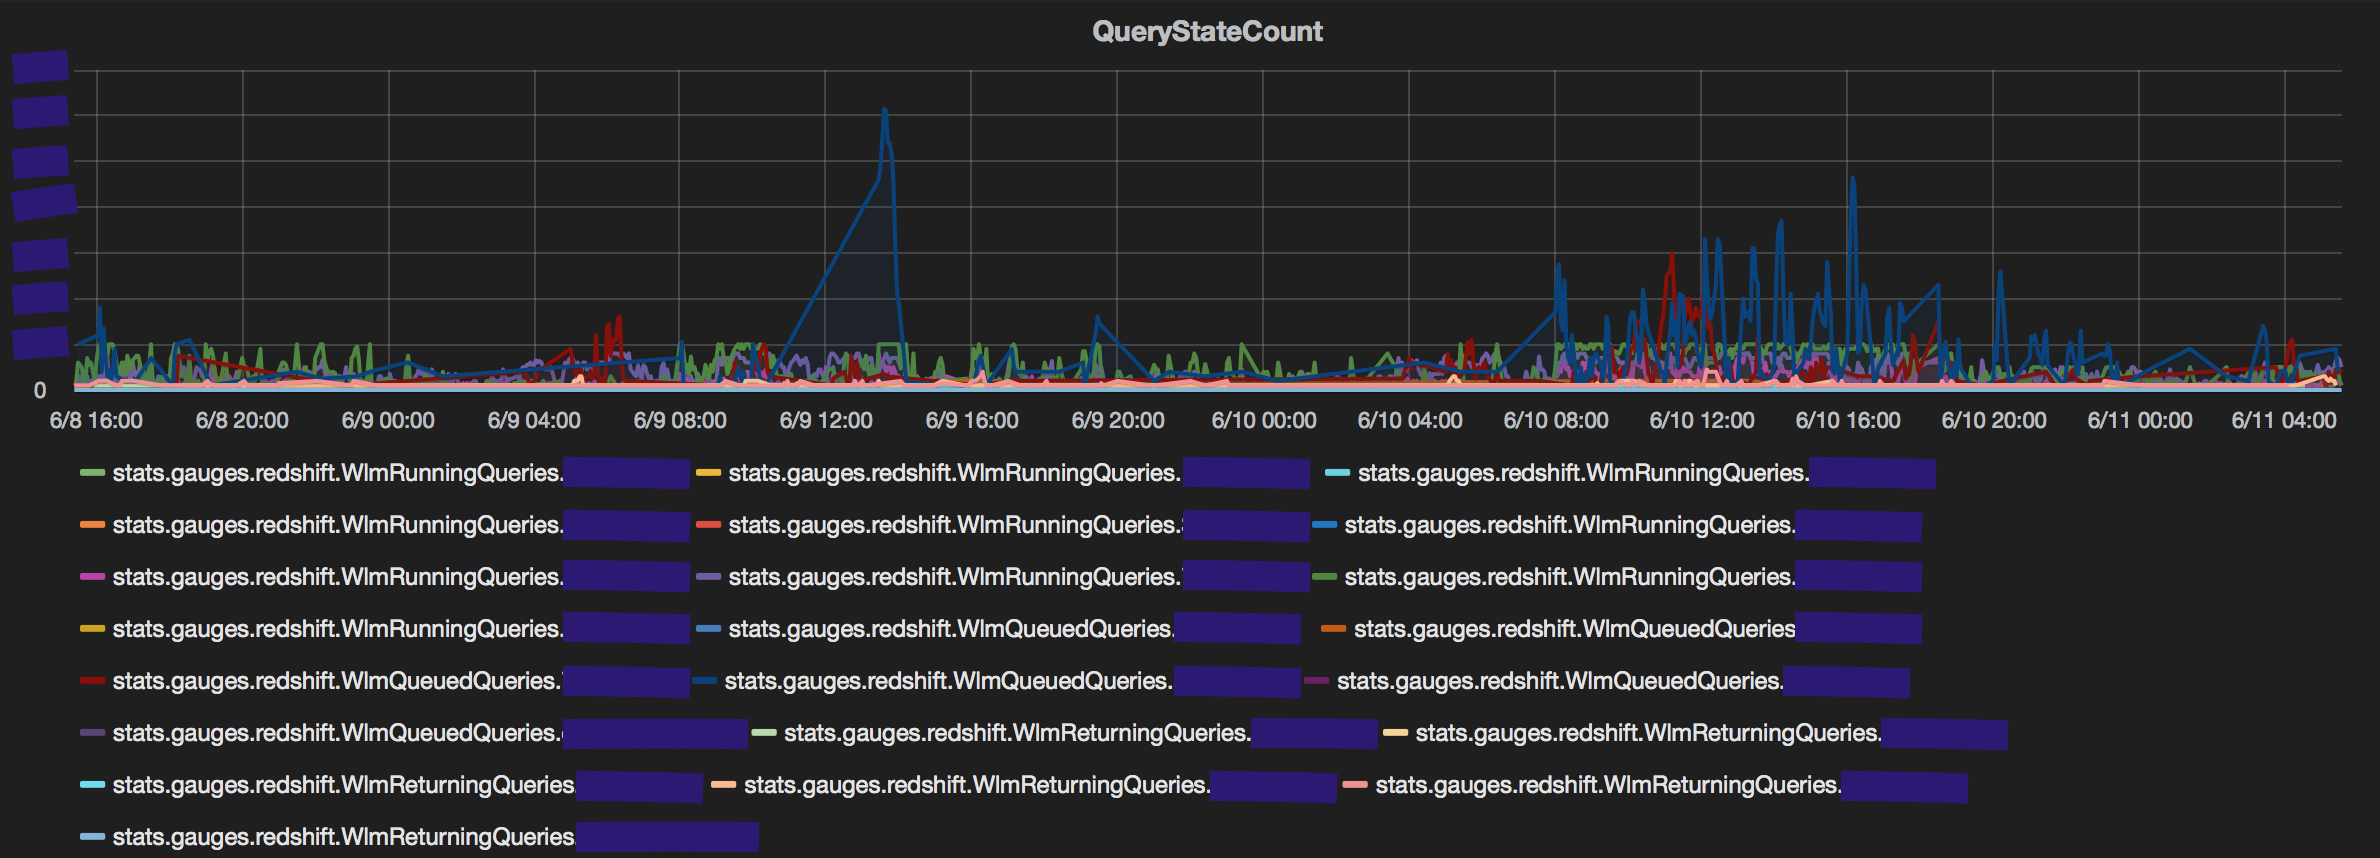
For how long though?
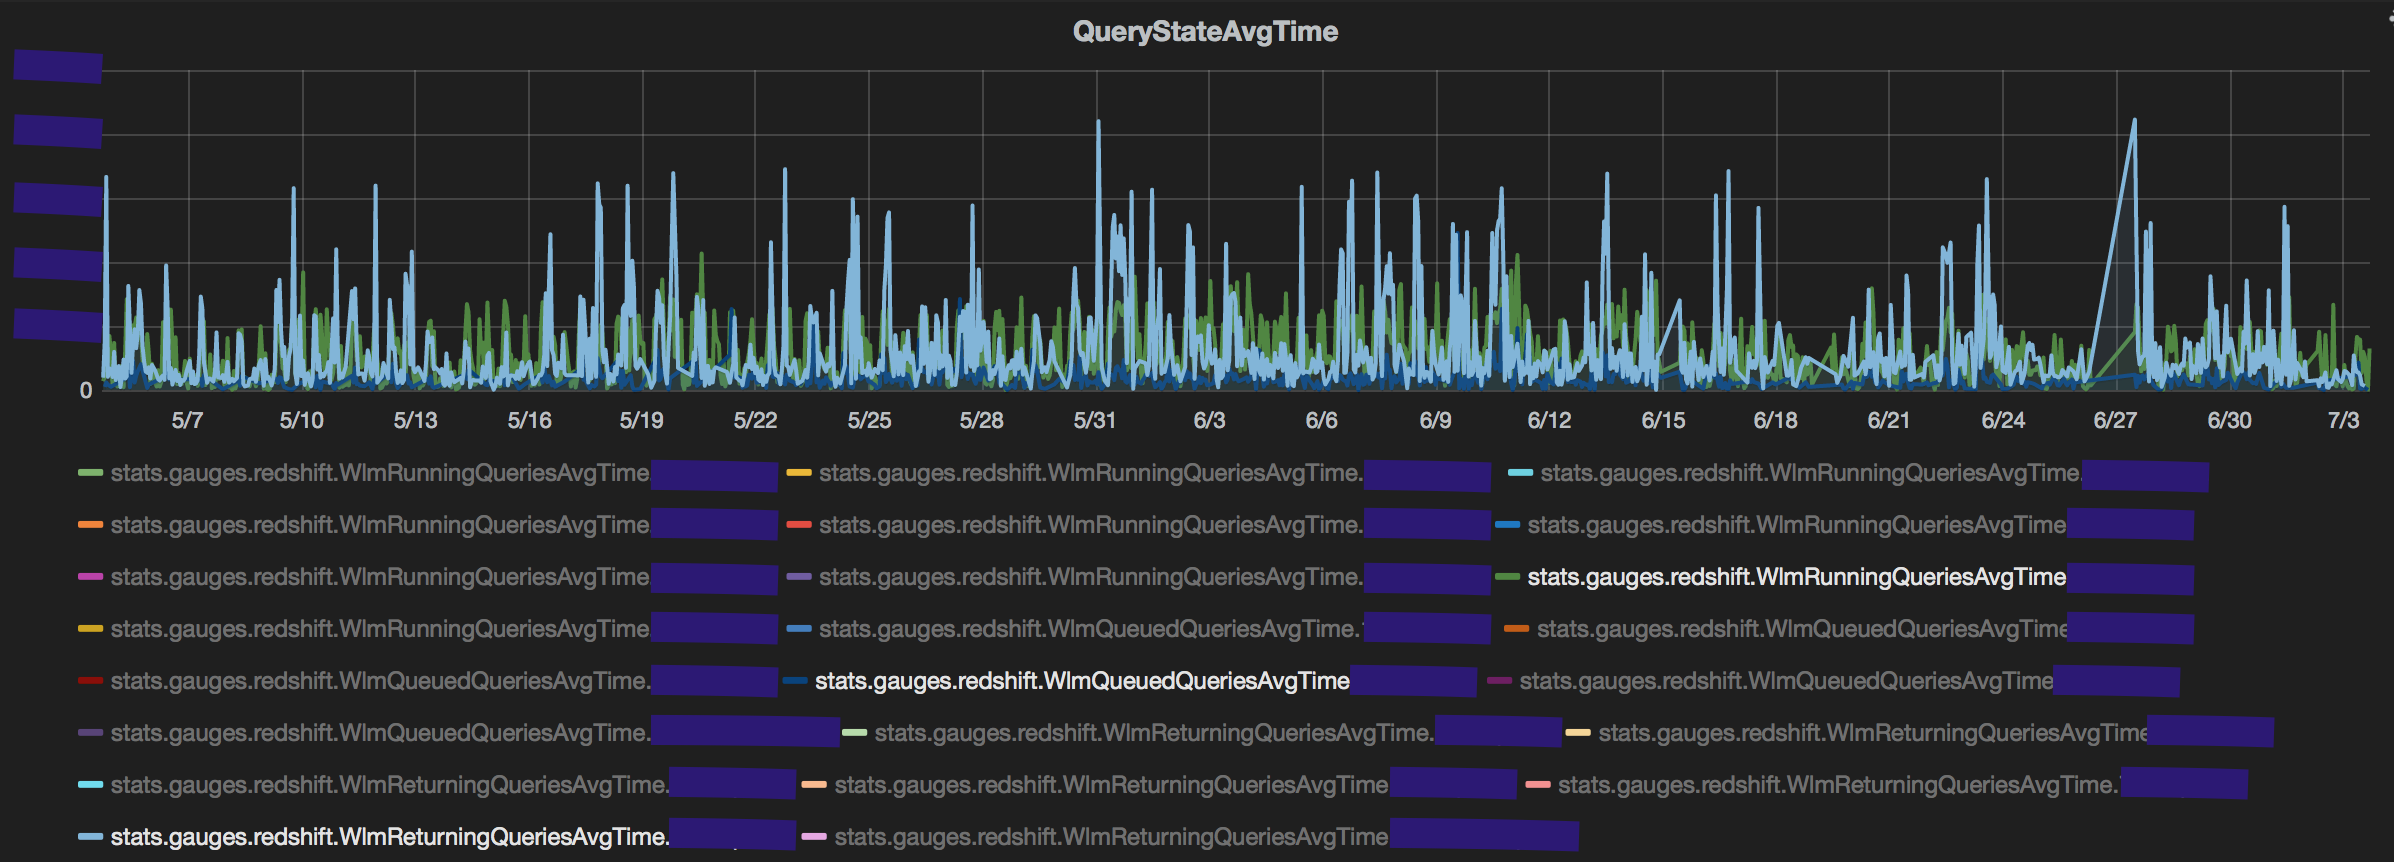
A spike in the number of queries will certainly increase the number of queued queries but it need not be a result of 'slowness'. An important metric to track would be the average queue/running/returning time in each queue. My 2 biggest takeaways:
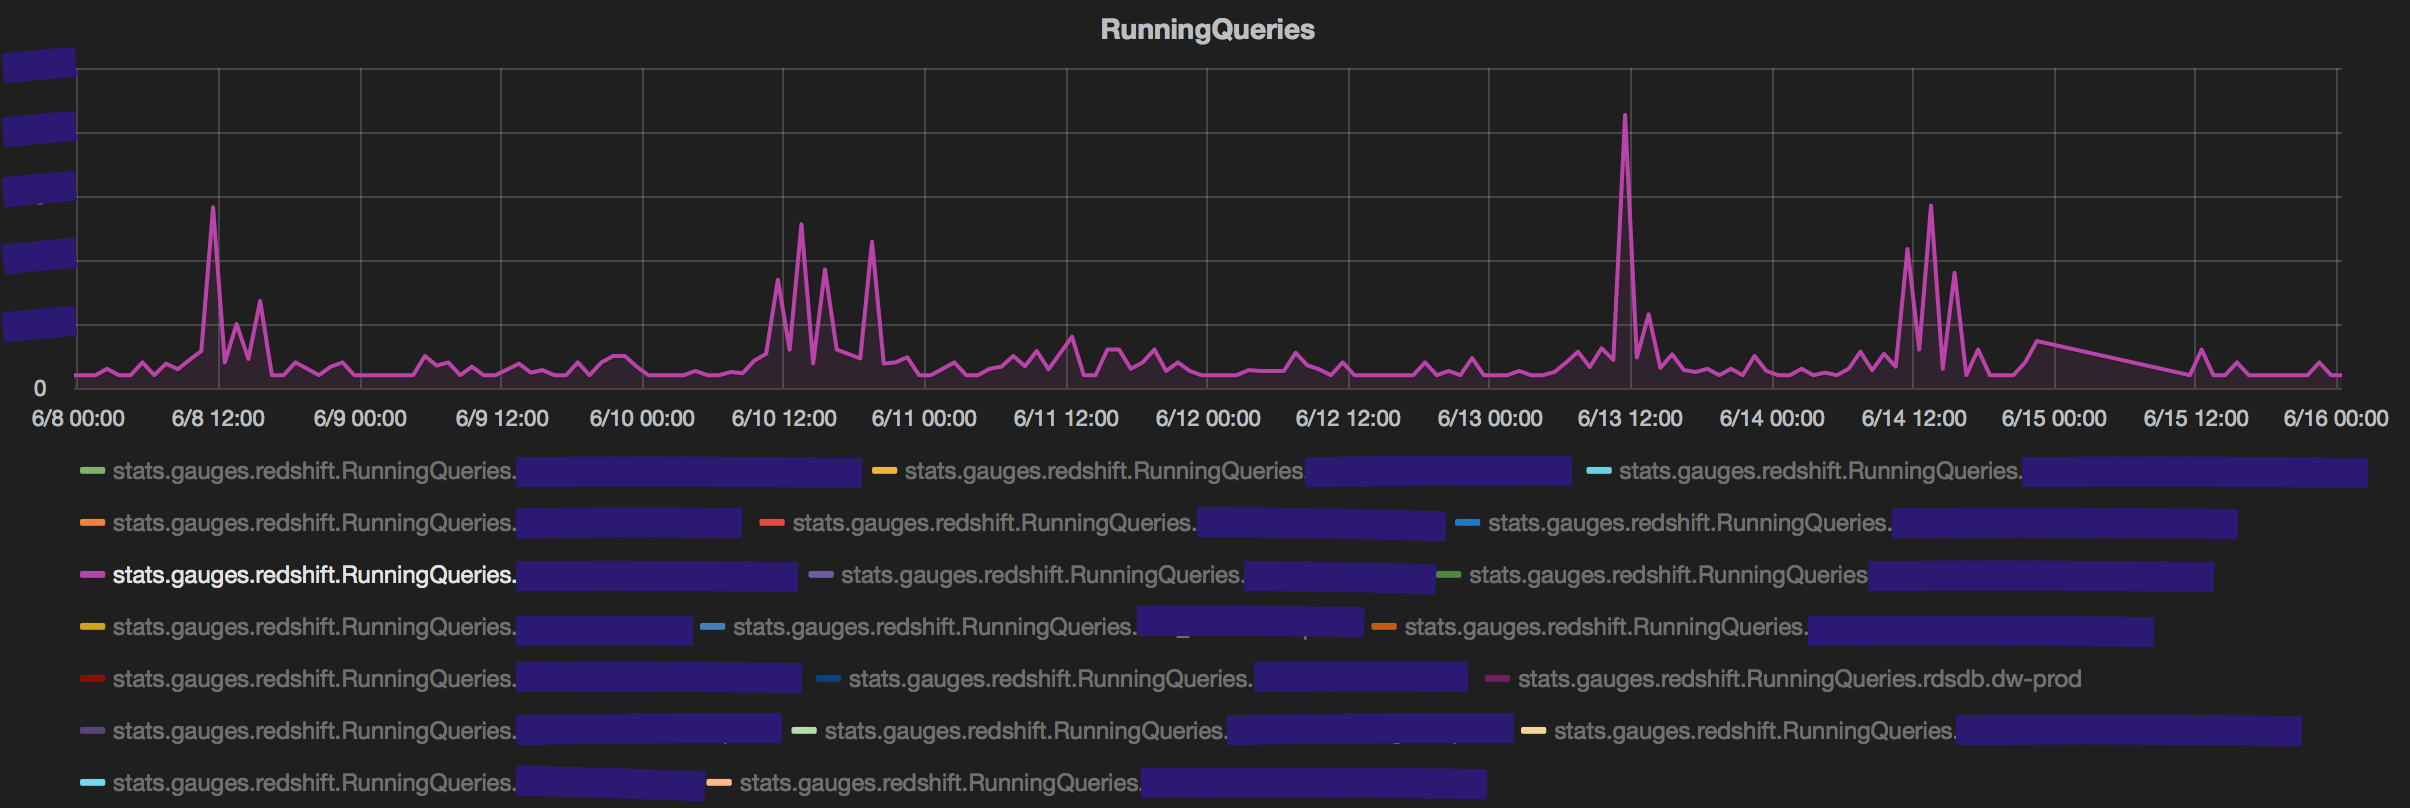
First, a spike in query count by a user that does not translate to high average time in any of the states is probably not a cause of concern. This could be due to aggregate queries (count(*), sum(), avg() grouped over few columns and pulling very fewer rows). The spike in queries fired by the user in magenta reflects on the count of queries queued in its service class but does not translate to higher queue time.
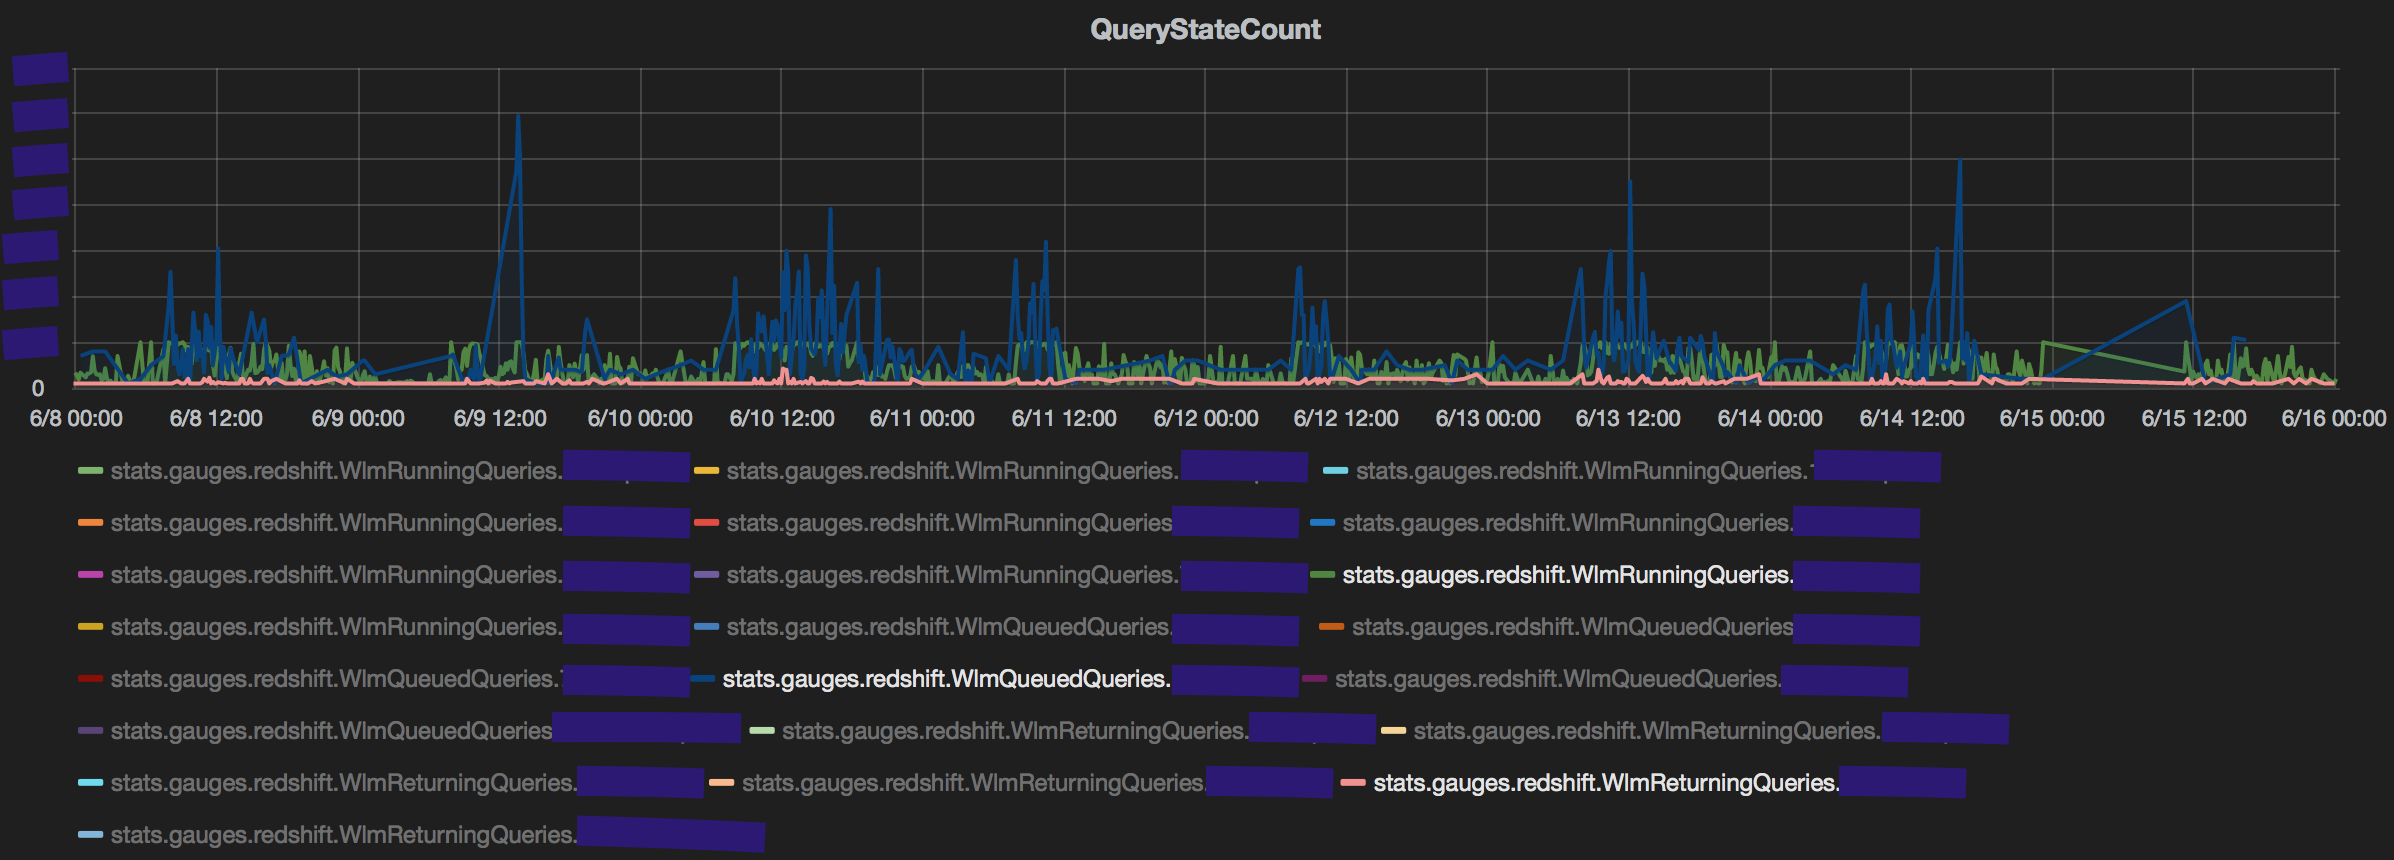
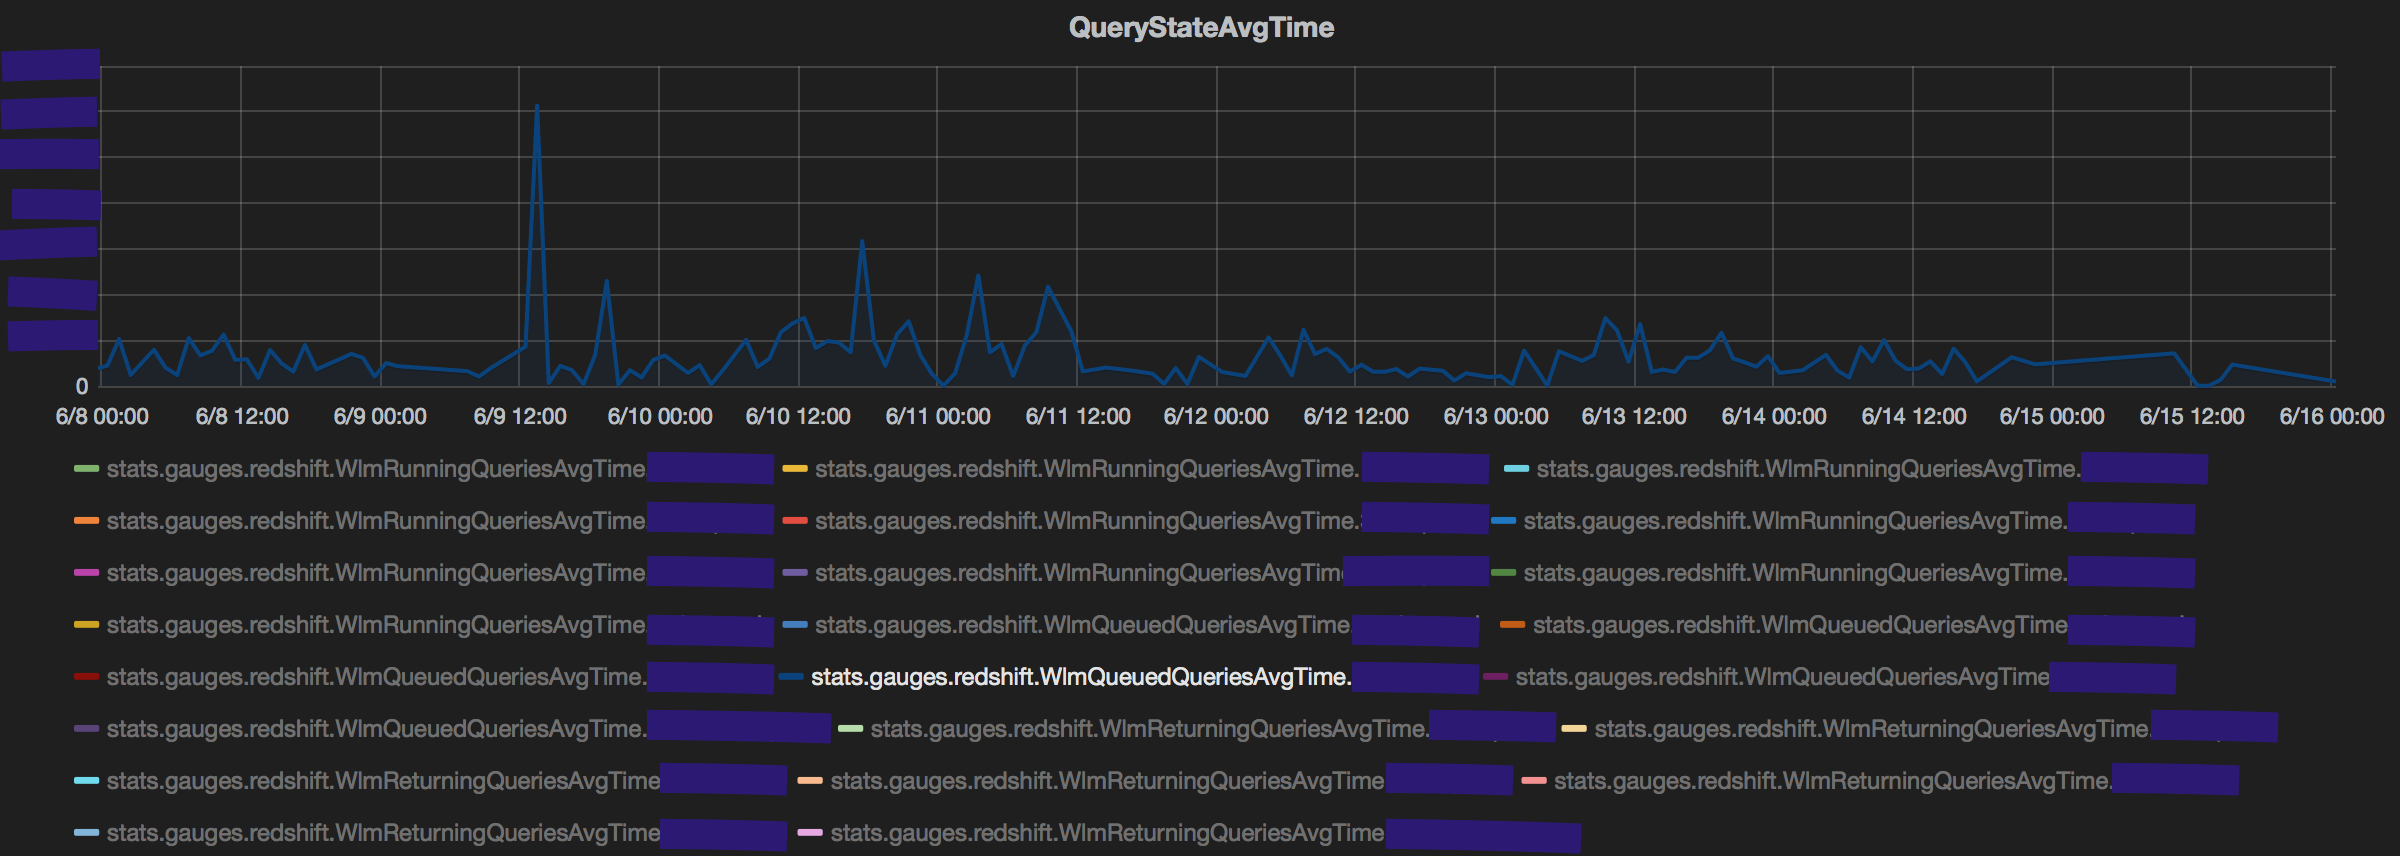
Second, an interesting observation is the impact that returning queries can have on performance. Specifically, queries that return large volumes of data (~100k rows) typically have 10x the average time when in the returning state than the queued/running state. This observation reinforces conventional wisdom of limiting the number of queries pulling many rows from redshift. The count of returning queries is consistently negligible compared to running and queued queries, yet the average time taken for queries in the returning state is always higher. (The average returning time is an average of Running+Returning. But even discounting that, the time taken in just returning is very high.)
Summon the culprit query
Graphs are great in doing a quick high level 'analysis' of the situation. But to take action, you would need to know which query/queries is/are really slowing down everything. Identification of a 'bad' query is not straightforward and far from accurate. RedEye relies on 2 key proxies that could be good indicators toward bad query performance - number of diskhits and number of broadcast rows. A variety of query level metrics (service class, username, queue time, execution time, slot count) are stored in MySql along with these 2. The following query can be used to identify such queries. The monitoring_schema and cluster_name would be config parameters.
SELECT username, query_id
FROM <monitoring_schema>.redshift_query_monitory_<cluster_name>
WHERE state = ‘Running’
AND (num_diskhits > 0 OR bcast_rows > <bcast_threshold>;
An aggressive approach could be to cancel queries from adhoc users automatically if they show up in the result of the above query.
CANCEL <query_id>
A sudden rise in disk space utilisation is a result of such queries resulting in plots similar to what we see below.

A peculiar Case
There were certain times when this poor performance was attributed to reasons other than the ones mentioned above. In the absence of an anomalous spike in any of the dashboards, performance would still be poor. Specifically, a query would be submitted to redshift, but no corresponding query_id would be generated by it in stl_querytext for upto 5 minutes. This would typically be accompanied by the following 2 observations on the dashboard.
- CPU Utilisation: The redshift cluster is composed of a leader node and multiple compute nodes. Under normal execution, the CPU utilisation of the compute nodes is significantly lower than that of the compute nodes. However, when redshift fails to assign a query_id for the query in
stl_querytext, the CPU utilisation of the leader node spikes. This happens since the leader node is tasked with generating the explain plan for the query. Explain plan generation must happen before the query is assigned an ID or even queued.
- Temp Table Creation:
stv_recentsshows that multiple temp tables prefixed withvoltare created in order to generate the explain plan, hence resulting in a spike in disk space.

SELECT COUNT(*)
FROM stv_recents
WHERE status = 'Running'
AND query LIKE ('%volt%');
The actual offending query has no query ID assigned and stv_recents will only show the queries fired to generate its explain plan. The PID returned by the table for those queries can be used to terminate it as pg_terminate_backend (pid)